We can say that Wireshark is a graphical version of Tshark. Aim of this article is to analyze some attributes of wireless packets captured using tshark on Elasticsearch. Tshark, Elasticsearch, Kibana, Logstash and Filebeat are used to analyze. Installation of Elasticsearch, Kibana, Logstash and Filebeat can be found on this link. An alternative solution is Docker.
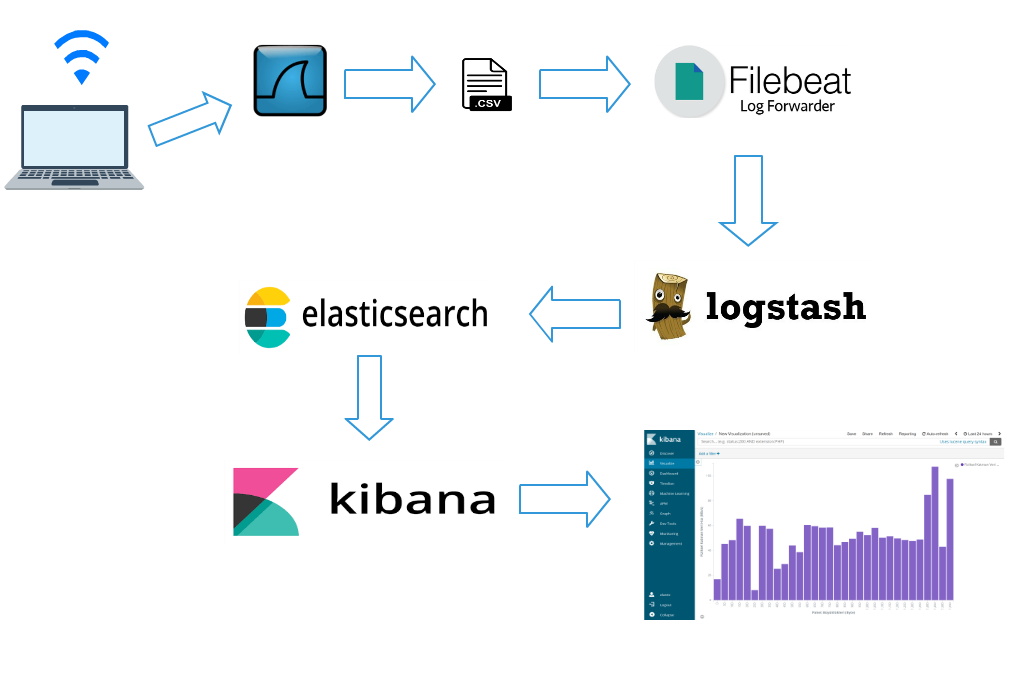
In a nutshell:
- Tshark captures wireless packets by using filters.
- Tshark writes captured wireless packets as .csv.
- Filebeat listens .csv file sends to Logstash.
- Logstash filters data again and sends to Elasticsearch.
- Analyze data by using Kibana. Dashboard, graph etc.
System architecture as the following:
Used filters to analyze wireless packets are as the following:
| Filtre | Description |
|---|---|
| _ws.col.Time | Time info |
| wlan.fc.type | Type |
| wlan.fc.type_subtype | Type/Subtype |
| radiotap.dbm_antsignal | Signal strength(RSSI) |
| frame.len | Frame length |
| radiotap.datarate | Data rate (Mb/s) |
wlan.fc type generate value one of 0,1,2. Meaning of these numbers are as the following:
| Value | Meaning |
|---|---|
| wlan.fc.type==0 | Management Frames |
| wlan.fc.type==1 | Control Frames |
| wlan.fc.type==2 | Data Frames |
wlan.fc.subtype generate values between 0 and 47. Meaning all of these values are on this link. Meaning of some values are on the table as the following:
| Value | Meaning |
|---|---|
| wlan.fc.type_subtype==8 | Beacon |
| wlan.fc.type_subtype==27 | Request To Send |
| wlan.fc.type_subtype==28 | Clear To Send |
1.Capture Wireless Packets and Write to CSV
Command with filters:
tshark -a duration:600 -i phy0.mon -t ad -t ad -lT fields -E separator=, -E quote=d -e _ws.col.Time -e wlan.fc.type -e wlan.fc.type_subtype -e radiotap.dbm_antsignal -e frame.len -e radiotap.datarate > tshark.csv
-a duration:600 capture wireless packets during 600 seconds
-i phy0.mon select interface that capture wireless packets. Might be diffrent on you.
-t ad time format. YYYY-MM-DD is selected here.
> tshark.csv name of output file.
Remainings are about how to separate attributes.
2.Listen Output CSV by Using Filebeat
Tshark listen tshark.csv and sends to Logstash. Your filebeat.yml configuration file should be as the following:
filebeat.modules:
- module: system
  syslog:
    enabled: false
  auth:
    enabled: true
    var.paths: ["/home/tshark.csv"]
name: test
output.logstash:
  hosts: ["localhost:5044"]
Link filebeat.yml
var.paths: ["/home/tshark.csv"] path of your .csv file. Need to be changed according to your .csv path.
You might access to filebeat.yml in Filebeat installation folder on Windows.
Path of filebeat.yml on linux systems :
cd /etc/filebeat
sudo vim filebeat.yml
3.Listen Filebeat, Get Data, Apply Filter and Send to ELasticsearch by using Logstash
We have configured Filebeat to send data to localhost:5044 on second step. We have to get this data from localhost:5044 by using Logstash. To do this we need to configure Logstash.yml input as the following:
input {
  beats {
    port => 5044
  }
}
We have to put some filters on Logstash.yml to send Elasticsearch properly. I give filters step by step. You can find Logstash.yml at the end of this section.
We give name to attributes as the following:
   csv {
     source => "message"
     columns => [ "col.time","frame.type","frame.subtype","rssi","frame.size","data.rate" ]
   }
We configure time format as the following
date {
              match => [ "col.time", "YYYY-MM-DD HH:mm:ss.SSSSSSSSS" ]
              target => "@timestamp"
              }
We add some new attributes to our data set as the following:
  mutate {
  add_field => {"[hour]" => "%{+HH}"}
  add_field => {"[minute]" => "%{+mm}"}
  add_field => {"[second]" => "%{+ss}"}

  }
We convert some attributes to integer to get statistical results as the following:
mutate {
     convert => [ "rssi", "integer" ]
     convert => [ "frame.size", "integer" ]
     convert => [ "data.rate", "integer" ]
     convert => [ "second", "integer" ]
     convert => [ "minute", "integer" ]
     convert => [ "hour", "integer" ]

   }
We convert numbers to meaningful results as the following:
   if[frame.type]=="0"{
   mutate {
     replace => [ "frame.type", "Management" ]
   }}
   if[frame.type]=="1"{
   mutate {
     replace => [ "frame.type", "Control" ]
   }}
   if[frame.type]=="2"{
   mutate {
     replace => [ "frame.type", "Data" ]
   }}
We need to send data to Elasticsearch as the following:
output {
  elasticsearch {
    hosts => ["http://localhost:9200"]
    index => "%{[@metadata][beat]}-%{+YYYY.MM.dd}"
    document_type => "%{[@metadata][type]}"
  }
}
If you are using x-pack security you need to put user and password areas on Logstash.yml as the following:
output {
  elasticsearch {
    hosts => ["http://localhost:9200"]
    index => "%{[@metadata][beat]}-%{+YYYY.MM.dd}"
    document_type => "%{[@metadata][type]}"
    user => elastic
    password => changeme
  }
}
When we finish to configure It should be : Logstash.yml.
Troubleshoot
If it doesn’t work, create a new Logstash.conf and copy content of Logstash.yml into this file. Copy newly create Logstash.conf into bin folder which in Logstash installation folder. Run logstash with newly created Logstash.conf file as the following:
./logstash -f Logstash.conf
-f indicates configuration file.
4.Last Step and Summary
In brief, after we have configured our tools we start to capture wireless packets by using tshark:
tshark -a duration:600 -i phy0.mon -t ad -t ad -lT fields -E separator=, -E quote=d -e _ws.col.Time -e wlan.fc.type -e wlan.fc.type_subtype -e radiotap.dbm_antsignal -e frame.len -e radiotap.datarate > tshark.csv
We start Elasticsearch, Kibana, Logstash and Filebeat.
For linux systems :
sudo systemctl start elasticsearch.service kibana.service logstash.service filebeat.service
Data will be indexed in Elasticsearch after while a time. We can create a new index pattern as the following: Management>Index Patterns >Create Index
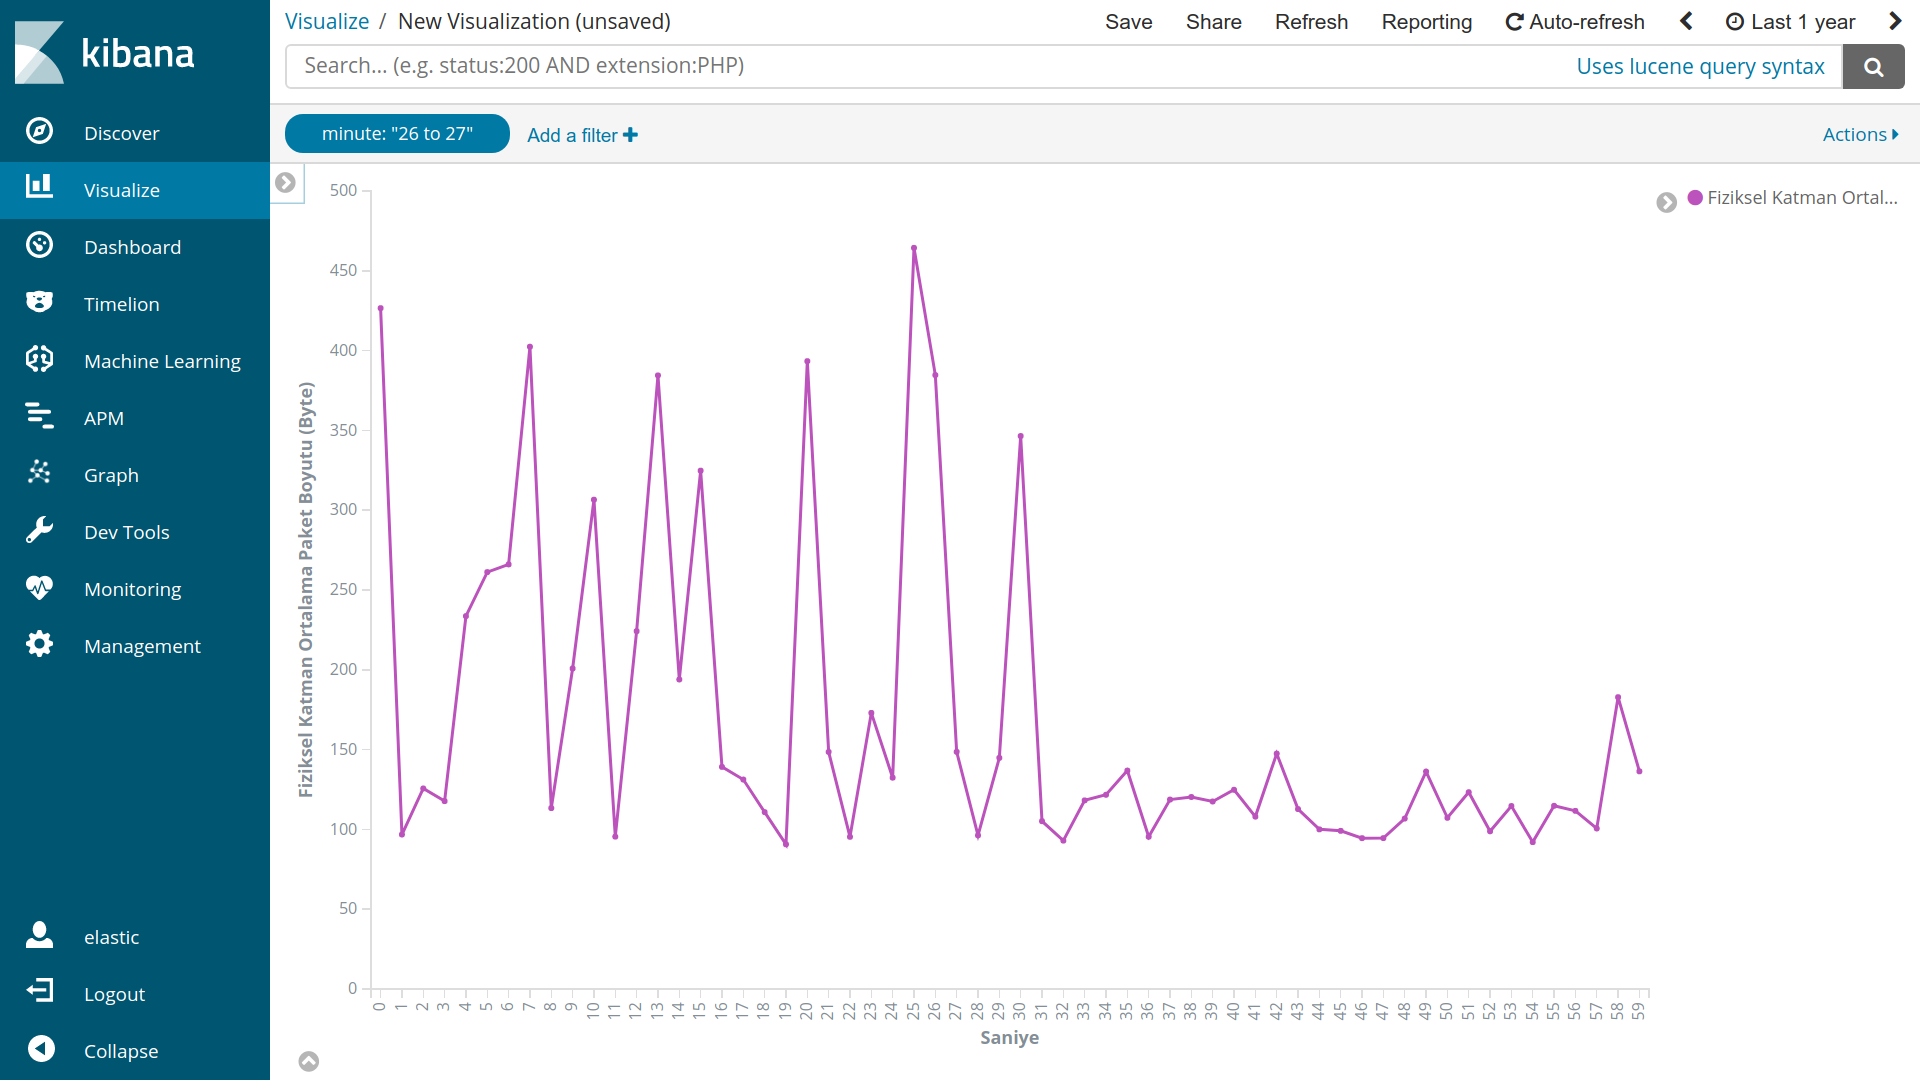
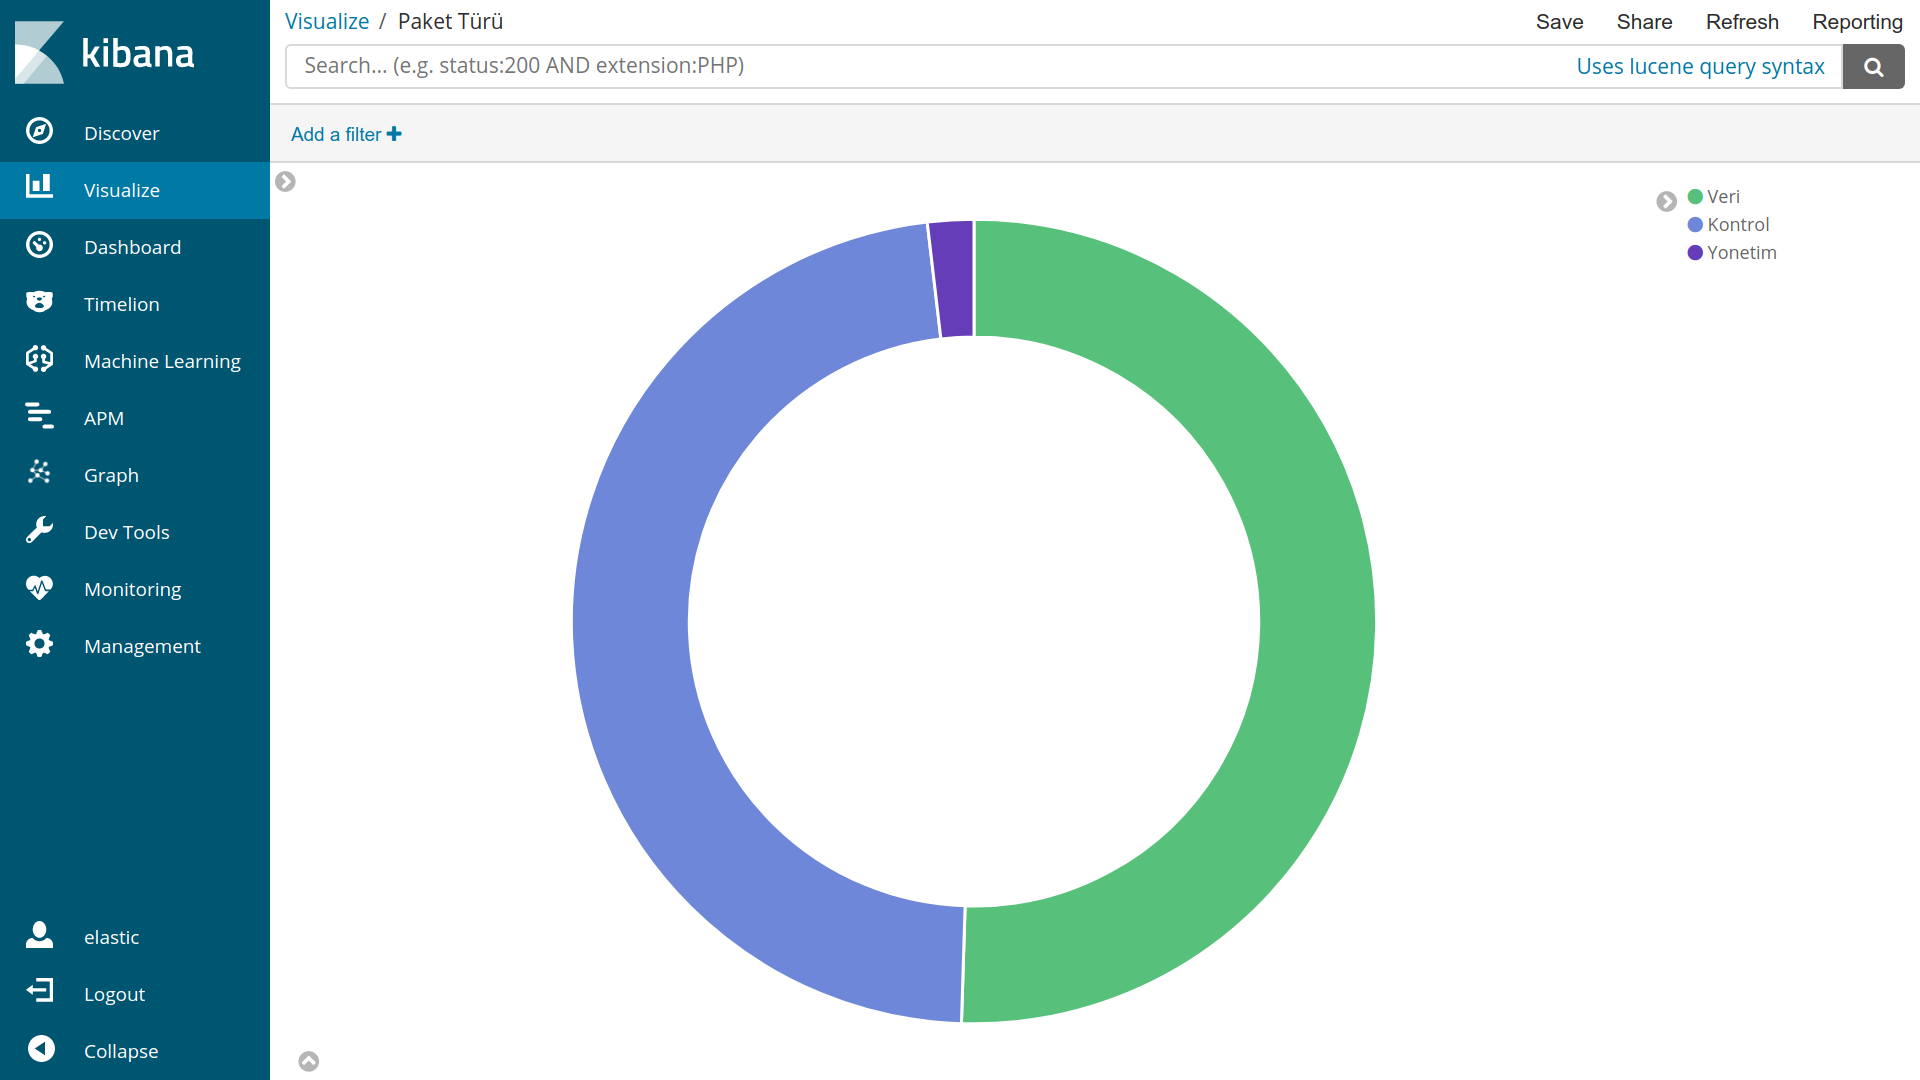
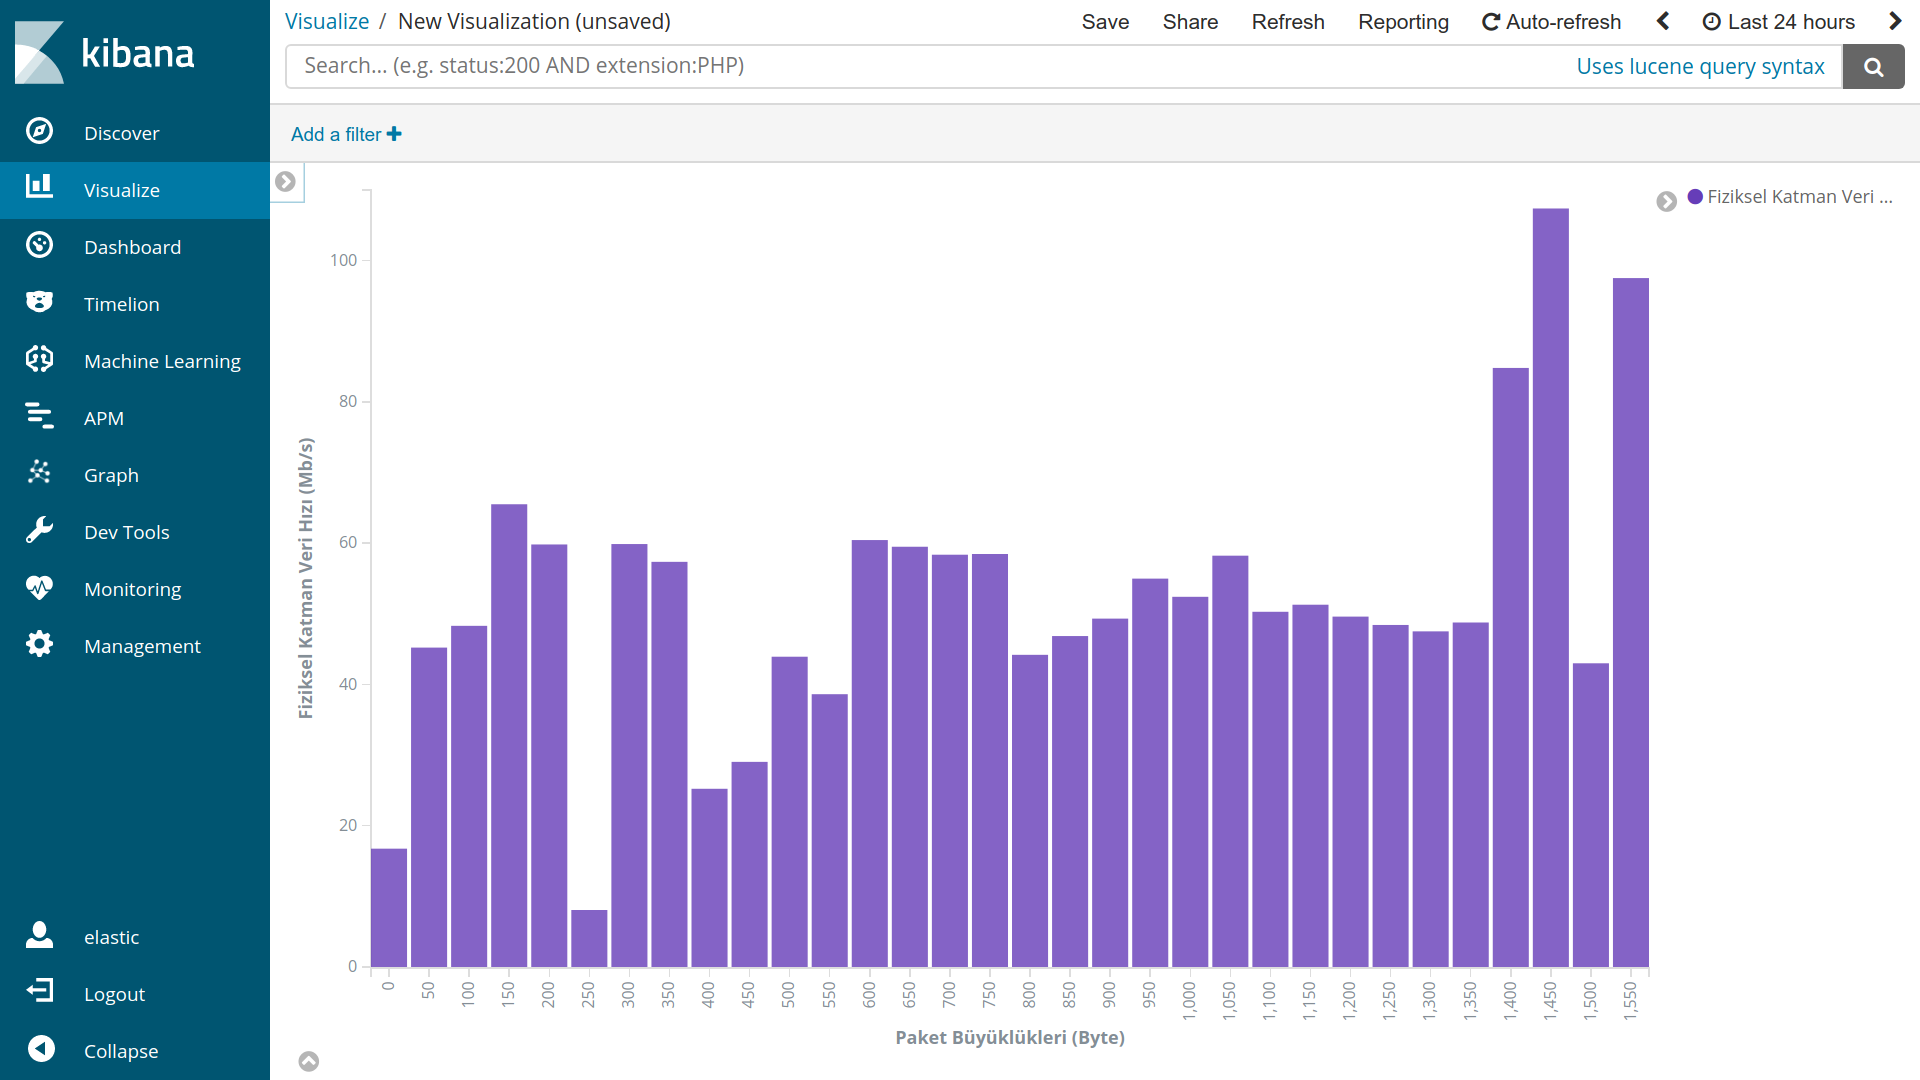
Now we can analyze data from Visualize tab.
Examples:
Resources
https://rudibroekhuizen.wordpress.com/2016/02/12/analyse-tshark-capture-in-kibana/
https://dalewifisec.wordpress.com/2014/04/29/wireshark-802-11-display-filters-2/